Charting a route to safe skies
7 July 2014Think of NATS and I’m willing to bet your first thought will be of our air traffic controllers, but there is also a really wide range of other activities we’re involved in, some of which are a little surprising – including my own.
I run a team of nine specialist cartographers whose job it is to ensure the UK’s aeronautical charts stay up-to-date and accurate. These charts contain the safety critical information that pilots have to rely on everyday when flying in and out of UK airports. They cover a huge range of procedural and operational information, from the angle of approach and the correct air traffic radio frequency, through to the location of any potential obstacles, like wind turbines or local glider clubs, for example.
")
London Heliport inbound and outbound procedures.
")
An instrument approach chart for Shoreham airport.
Every time there is a change on the ground or in procedure, it’s our job to confirm the details and update the chart – a process that can sometimes take months depending on the complexity of the change and the safety case involved. As you can imagine, accuracy is absolutely paramount, so everything is double and sometimes triple checked and once updated, the charts are made available through what’s called the UK Integrated Aeronautical Information Publication (or AIP) for pilots and third party suppliers to access and use.
It is a similar process for the aerodrome charts we create and maintain. For something like the new Terminal 2 at Heathrow, we’ve been working closely with the airport all the way through the construction process to make sure our charts reflect the picture on the ground as taxi ways open and close and stand availability and runway exits change.

An extract from the Heathrow aerodrome chart.
It’s absolutely vital for pilots and air traffic controllers to have confidence in this information so that the airport is both safe and running as efficiently and smoothly as possible. The charts are updated each month, but we actually work three months in advance to help ensure there aren’t any surprises.
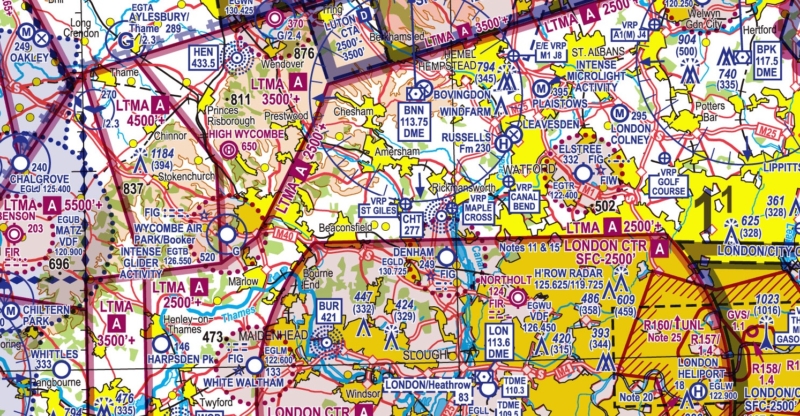
Aside from the charts created for Instrument Flight Rules – usually commercial – air traffic, we’re also responsible for maintaining the Visual Flight Rules charts that all private pilot licence holders will be familiar with. With the underlying Ordnance Survey mapping, they look immensely detailed – and they are – but like most maps and charts if you take the time to study them clarity does begin to emerge.

An extract of the Visual Flight Rules chart for Southern England.
Everything a pilot might wish to know, from colour coded airspace classifications and military danger zones through to the location of powerlines and airfields large and small is included. The chart specification is set by the CAA based on the ICAO international standards, but we do also make stylistic changes based on user feedback and overall the team makes hundreds of updates to each new edition.
While most of our work is UK based, as NATS itself is growing internationally so too are we. We recently completed a number of charts in support of our airspace and procedure redesign work in Qatar. It was exciting to be involved in an overseas project and certainly something that we’re hoping to do more of in the future.
At the moment our work is surprisingly manual. Each chart has to be updated individually, but that is set to change in the coming 18 months or so. As you might have seen, NATS and Avinor – the Norwegian ANSP – recently signed a deal with a company called Avitech for a new shared Aeronautical Information Management platform. This will move us to a purely data based system, where every update will automatically be made to each relevant chart. Update once, use many times is the philosophy in what will be a radical and exciting change to how we work.
If you have any questions about cartography, aeronautical charts or how we work, just leave a comment below and I’ll be happy to answer.
You may also be interested in...

Try our ATC games: Do you have the right stuff?
Read more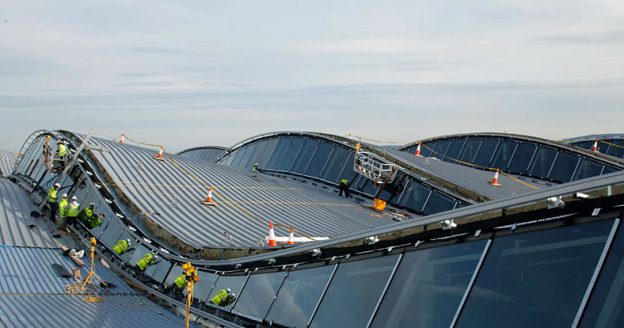
A sneak peek inside Heathrow Terminal 2
Read moreComments
Please respect our commenting policy and guidelines when posting on this website.
18.07.2014
12:11
drbeauwebber
Looking at the map, my first comment is “How much less cluttered the airspace is over Manston Airport, Kent”.
With access mostly over water, there were seven diversionary landings, diverted from Heathrow to Manston, last year.
We hear how busy Heathrow and Gatwick airports are, that they need new runways so desperately that people will be thrown out of their homes.
But Manston Airport, with the 4th longest civilian runway South of Birmingham, has been closed by its owner, supposedly to builld houses.
Please, the 20,000 supporters of Manston AIrport are asking, where is the joined up thinking – PLEASE SEND US THESE EXTRA PASSENGERS AND FREIGHT ! We want our airport open again !
I give links to a number of fact sheets about Manston Airport :
Save Manston Airport Leaflet – Facts and Myths.pdf
http://www.lab-tools.com/SMA/Save_Manston_Airport_Leaflet_-_Facts_and_Myths.pdf
Arise to Protect – Save Manston Airport – v2.pdf
http://www.lab-tools.com/SMA/Arise_to_Protect_-_Save_Manston_Airport_-_v2.pdf
The origin of the “time to backside on plane seat” infographics in the above document are described in :
Manston Airport Kent has major travel advantages – v2b.pdf
http://www.lab-tools.com/SMA/Manston_Airport_Kent_has_major_travel_advantages_-_v2b.pdf
We have even conducted an on-road and “virtual flight” validation of these timings :
http://www.facebook.com/events/580892218698984/ – Manston beat Gatwick by 1 hour 22 minutes.
Please support the 20,000 Kentish people who are determined to have their Manston Airport back up and operational.
Cheers,
Dr. Beau Webber
Lab-Tools Ltd., Canterbury & Ramsgate
http://www.Lab-Tools.com July 2014.
Save Manston Airport group :
http://www.savemanstonairport.com
http://www.facebook.com/savemanstonairport
http://www.facebook.com/groups/savemanstonairport